Products > Bus Analyzer Module
Introduction to the SCSItoolbox Bus Analyzer Module (BAM)
Description of BAM
BAM is an software bus analyzer that can capture, display, and analyze trace data from any peripheral bus, including SCSI, Fibre Channel, IDE, ATA, SATA, and SAS.
BAM offers complete versatility as far as choice of phases that are captured and displayed, capture modes to minimize I/O impact, buffer size and capture size, and device(s) to capture trace data from.
Pre-Capture Setup
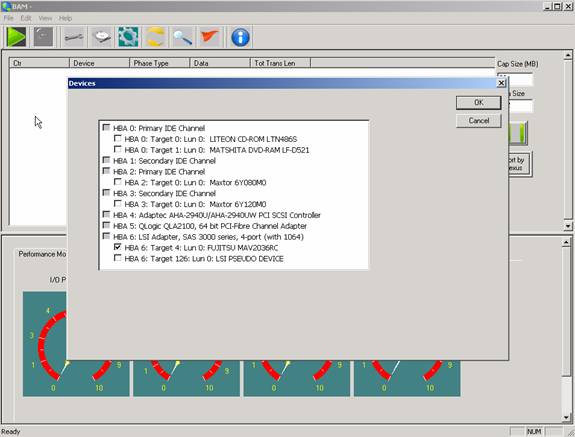
Identifying devices to capture
The Device screen displays all devices attached to all adapters on the system. In performance mode you can select one device, in capture mode you can select as many devices as you wish.
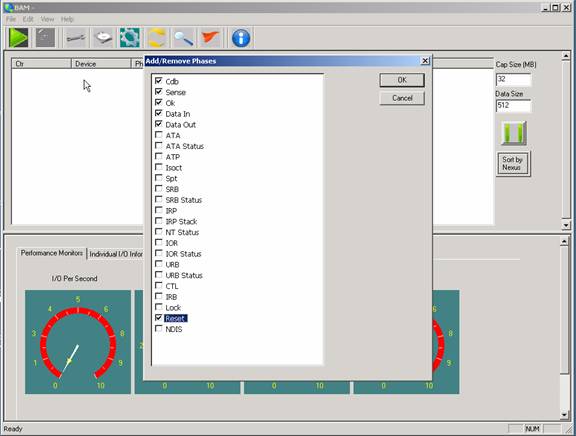
Identifying Phases to capture
Select the phases that you wish to record during capture by using the Phases screen.
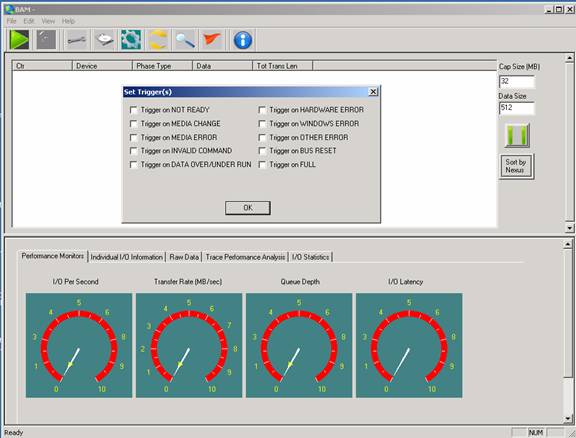
Selecting Triggers
Use the Trigger Screen to select trigger conditions to stop trace capture.
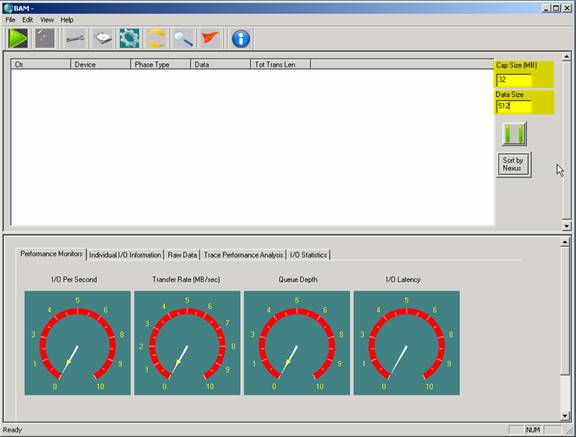
Setting Capture Buffer size and Phase Data Size
The amount of trace data you will be able to capture is determined by the size of the Capture Buffer. The Capture Buffer uses system memory enter the amount of memory you can allocate to trace memory in the Cap Size field. Enter this number in Megabytes.
Enter the amount of data (in bytes) from each phase that you wish to capture in the Data Size field up to 64K.
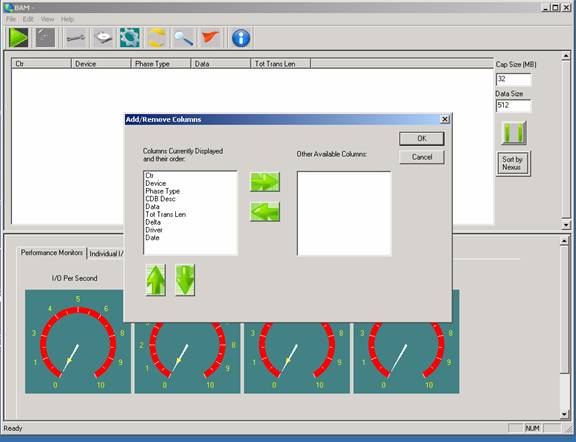
Identifying columns to display
Use the Columns screen to select the data you wish displayed on the screen, and the order you would like the data columns to be in. In our example we will show all data columns.
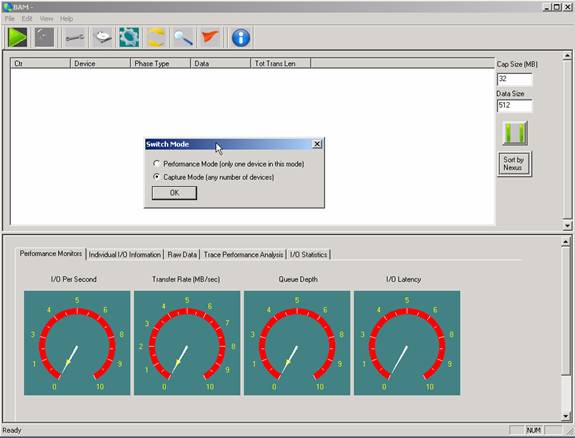
Selecting the mode
Use the Mode Selection screen to choose between Performance mode and Capture Mode. Performance mode allows data from one device to be captured, and the phases displayed in real-time during capture will be limited to not impact system performance. Once a Performance Mode capture is stopped all phases will be displayed on the screen.
In Capture mode you may capture data from multiple devices, and all phases are displayed in real-time during capture.
Note: - during Capture Mode capture you may use the Pause/Continue button to the right of the phase display to momentarily pause phase data scrolling.
Starting and stopping capture
Click the Start Capture button (the green arrow) to start the capture

And click the Stop button (the red stop sign) to stop capture
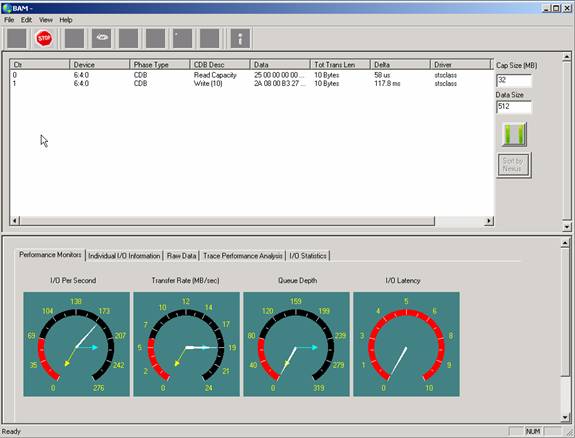
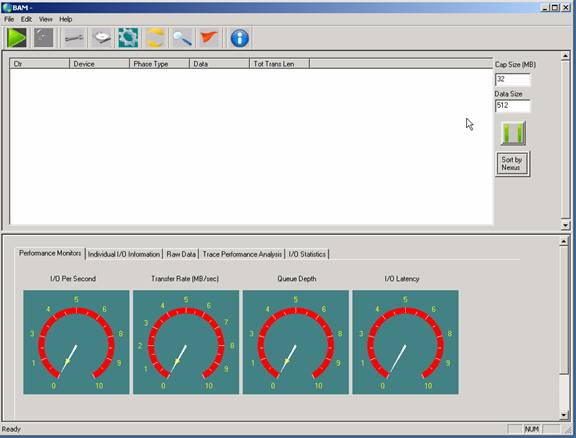
Monitoring while tracing
During trace capture the Performance Monitor tab will show real-time performance data such as Number of I/Os per second, Transfer rate in MB/second, Maximum Queue Depth achieved, and I/O Latency. These displays show the maximum, average, and minimum values.
Post Capture Analysis
Trace Performance Analysis
The Trace Performance Analysis tab displays statistical information about the trace data
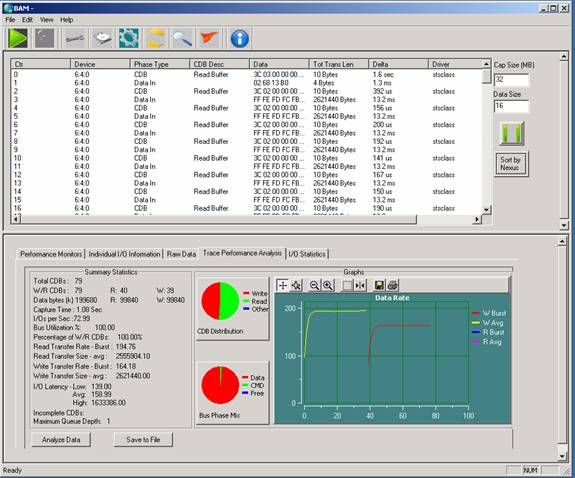
Information on type of I/O,data size, transfer rates, I/O rates, and intercommand I/O latency are displayed, as well as graphs of CDB type distribution, and Bus Phase mixture over the trace capture period. Read and Write Transfer rates are displayed in a scrollable graph.
Data Analysis
The top section of the tool displays trace data, including the device ID, the Phase Type, CDB Description, Data, Data Length, Delta Time, what OS driver issued the IO, and Date/Time.
Note: - trace data can be displayed in two modes:
- Sorted by time
- Sorted by Nexus
Time sorting displays the trace data in the order it occurred on the bus.
Nexus sorting will group phase data for a given nexus together. For example, nexus mode will group commands and data together even if other commands had occurred between the command and data phase, such as would be the case with command tag queuing or with interleaved capture of multiple device data.
The default mode is Sorted by Time change modes by clicking the Sort by button
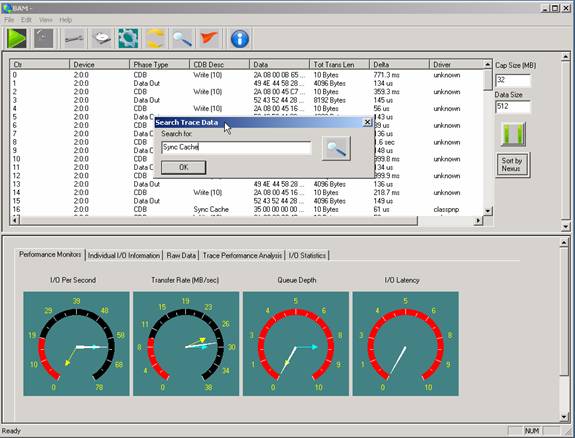
Searching through Trace Data
The Search tool allows you to specify a data pattern to seach for within the trace data
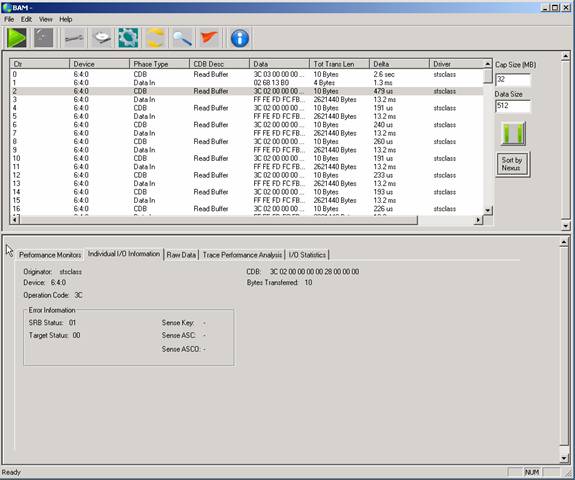
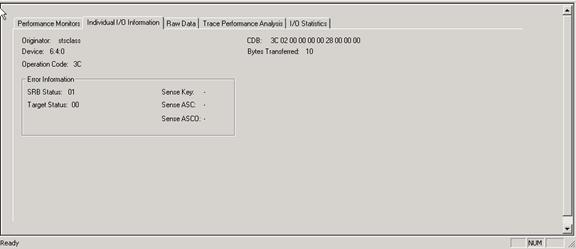
Individual IO information
Information on any Command may be viewed with the Individual I/O Information tab. This information will display the OS driver that originated the IO, the device address, the OpCode of the CDB, all CDB bytes, plus error information if the command had any type of error condition.
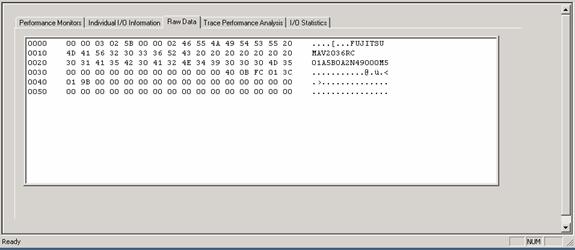
Raw Data View
Data captured may be viewed using the Raw Data tab
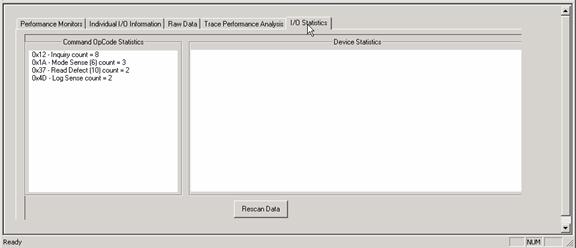
IO Statistics
Statistics about the type and amount of commands captured may be viewed with the IO Statistics tab
|